Next Day Delivery for just £15.00
Article
Every day, Britain quite literally moves on millions of small, unseen wheels. From the hospital bed that carries a patient to surgery, to the roll cage that delivers groceries to front doors, to the assembly jig guiding a car door down a production line, these castors and wheels form an invisible yet crucial layer of national infrastructure.
A quiet revolution in machine mobility is arriving at the heart of British industry. As manufacturers report renewed output growth – recent sector commentary points to rising activity in aerospace and transport equipment and growing uptake of heavy?duty mobility components – attention is turning to the small engineering decisions that multiply into national productivity gains.
At the same time, expanded warehousing, sustained passenger volumes at UK airports and persistent pressure on NHS capacity mean more of Britain’s equipment is on the move than ever before.
New analysis of public data reveals the scale of this “movement engineering” and how deeply it supports the UK’s essential sectors. Together, Britain’s factories, hospitals, warehouses and airports rely on an estimated 149 million industrial castors: roughly five to six for every household in the country. This report compiled by Coldene, Britain on the Move, quantifies that hidden layer of infrastructure. The numbers reveal how something as mundane as a wheel can determine whether a production line keeps running, a ward stays operational, or a luggage bay clears on time.
This analysis reviewed data sector?by?sector: manufacturing output and industry benchmarks, ONS business demography for warehousing, NHS bed and asset ratios, and CAA passenger figures for airports are combined to build a national model. The result is a data?driven case for treating movement engineering (wheel design, materials choice, maintenance regimes and procurement standards) as a matter of economic resilience and operational safety, not mere kit lists.
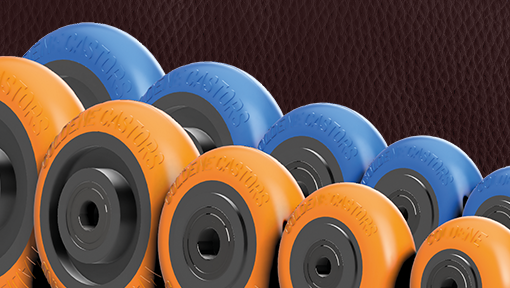
Movement engineering describes the design and use of industrial castors and mobile handling systems that allow heavy or complex equipment to move safely and efficiently. Although largely invisible, this quiet branch of engineering underpins the daily life of the nation.
| Sector examined | Why it matters | Typical wheeled assets |
| Manufacturing | Movement inside factories – materials, jigs, workstations | Mobile racks, benches, dollies, assembly carts |
| Logistics & Warehousing | Movement between facilities – goods in transit | Roll cages, pallet dollies, parcel cages |
| Healthcare | Movement in patient care and services | Hospital beds, clinical and catering trolleys |
| Airports | Passenger and cargo handling | Luggage trolleys, baggage carts, service dollies |
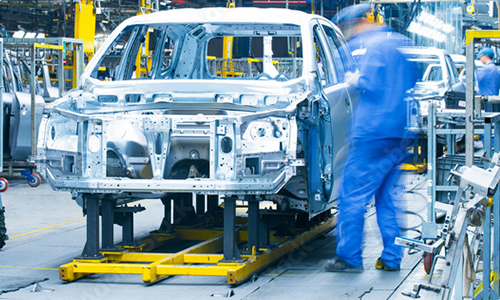
Manufacturing remains the largest contributor to Britain’s “movement footprint”.

According to ONS data, UK factories generated £452 billion of output in 2024. Based on standard industrial equipment ratios, this translates to around 34.9 million mobile handling units, or approximately 139 million castors.
| Sub-sector | Output (£ billion) | Estimated castors (million) |
| Food & drink manufacturing | 95 | 5.7 |
| Automotive & transport equipment | 80 | 5.8 |
| Machinery & metal products | 110 | 6.6 |
| Other manufacturing | 167 | 9.3 |
| Total manufacturing | 452 | 27.4 million units ? ? 139 million castors |
Inside factories, almost every component moves several times before it becomes a finished product. When a wheel locks or fails, production halts; a reminder that productivity often depends on the smallest components.
Outside the factory gates, Britain’s warehousing and logistics network has nearly doubled in a decade. ONS Business Demography data list over 465 active enterprises in the sector, forming the UK’s “golden logistics triangle”. Typical premises house hundreds of mobile handling systems — roll cages, pallet dollies, and parcel carts — underpinning the e-commerce economy.

The sector is estimated to rely on around 261,000 mobile units, fitted with 1.18 million castors.
| Indicator | 2013 | 2018 | 2023 | Change (2013–2023) |
| Number of warehousing & logistics premises (ONS Section H) | 250 | 380 | 465 | +86% |
| Estimated average floor space per site (m²) | 8,000 | 10,000 | 12,500 | +56% |
| Estimated mobile handling units per site | 500 | 700 | 900 | +80% |
| Total mobile handling units (nationwide) | 125,000 | 266,000 | 419,000 | +235% |
| Average castors per unit | 4.5 | 4.5 | 4.5 | N/A |
| Estimated total castors in operation | 0.56 million | 1.2 million | 1.9 million | +239% |
Every delivery and every parcel that arrives on time owes something to these castors, rolling through the country’s distribution centres and loading bays.
The NHS operates one of the largest mobile infrastructures in Britain. NHS England’s KH03 dataset for Q1 2025/26 reports 130,060 overnight beds in England, with an occupancy rate of 89.2%. Almost every bed sits on four castors, and each is supported by a web of mobile assets: trolleys, carts and cleaning units.

Based on NHS Supply Chain and Health Estates Journal benchmarks, hospitals operate about 2.1 wheeled assets per bed, giving 273,000 mobile units and 1.09 million castors in England, or around 1.3 million across the UK.
| Equipment type | Ratio per bed | Estimated units | Estimated castors |
| Bed (mobile) | 1.0 | 130,060 | 520,240 |
| Clinical trolleys | 0.3 | 39,018 | 156,072 |
| Catering trolleys | 0.3 | 39,018 | 156,072 |
| Equipment carts | 0.4 | 52,024 | 208,096 |
| Cleaning trolleys | 0.1 | 13,006 | 52,024 |
| Total (England) | 2.1 assets per bed | ? 273,000 | ? 1,090,000 |
These castors are the quiet enablers of clinical care, supporting patients, staff and essential logistics across the NHS.
Airports form another vital tier of the UK’s rolling infrastructure. Across all British airports, passenger traffic reached 276 million in 2023, according to CAA data.

Applying standard operational ratios for trolleys and carts, this equates to around 1.85 million mobile units and 7.4 million castors in total.
| Equipment type | Ratio per 1,000 passengers | Estimated units | Estimated castors |
| Luggage trolleys | 5 | 1,380,000 | 5,520,000 |
| Baggage carts | 1 | 276,000 | 1,104,000 |
| Service carts | 0.5 | 138,000 | 552,000 |
| Ground-cargo dollies | 0.2 | 55,200 | 220,800 |
| Total (UK airports) | N/A | ? 1,849,200 | ? 7,396,800 |
That equates to one industrial castor for roughly every 37 passengers who fly in or out of the UK each year.
Combining all four sectors produces the first composite picture of how Britain moves. Across manufacturing, logistics, healthcare and aviation, the UK operates at least 37 million mobile systems supported by 149 million industrial castors.
| Sector | Estimated mobile units | Estimated castors | Share of total |
| Manufacturing | 34.85 million | 139.4 million | 93.4 % |
| Warehousing & Logistics | 0.26 million | 1.18 million | 0.8 % |
| Healthcare | 0.27 million | 1.09 million | 0.7 % |
| Airports (UK-wide) | 1.85 million | 7.4 million | 4.9 % |
| Total (modelled) | ? 37 million | ? 149 million | 100 % |
Movement engineering is a silent driver of the UK economy. In factories, it saves time; in hospitals, it saves effort; in logistics, it saves cost; and in airports, it keeps the country moving. When the small components fail, the systems they support grind to a halt.
Engineers at Coldene Castors – a British manufacturer specialising in industrial mobility systems – helped interpret the practical side of this analysis. Their insight shows how decisions on wheel design, materials and load-bearing can ripple out into national productivity and safety.
The study quantifies “movement engineering” using official UK data and conservative engineering benchmarks to estimate the scale of mobile handling systems and castors in use across key sectors.
Each sector’s official statistics (beds, output, enterprises, passengers) was used as a base. Ratios for wheeled assets were drawn from public reports, NHS supply frameworks, logistics audits and manufacturing benchmarks. All calculations assume four castors per unit, unless otherwise stated.
| Sources | Method | Result | |
| Manufacturing | ONS UK Manufacturers’ Sales by Product (2024); Index of Production (2025) | 10,000 mobile units per £1bn output; 4 castors per unit | 34.9m units ? 139.4m castors |
| Warehousing & Logistics | ONS Business Demography 2023; ONS The Rise of the UK Warehouse (2022) | 250–1,000 units per enterprise; 4.5 castors per unit | 261k units ? 1.18m castors |
| Healthcare | NHS England KH03 Bed Availability and Occupancy (Q1 2025/26); NHS Supply Chain Framework (2024) | 2.1 wheeled assets per bed; 4 castors per unit | 273k units (England) ? 1.3m castors (UK) |
| Airports (UK-wide) | CAA / Airports UK (2023); Heathrow ratios | 5 trolleys + 1 cart + 0.5 service + 0.2 dolly per 1,000 passengers; 4 castors each | 1.85m units ? 7.4m castors |
| Sector | Mobile units | Castors | % of total |
| Manufacturing | 34.85m | 139.4m | 93.4% |
| Warehousing & Logistics | 0.26m | 1.18m | 0.8% |
| Healthcare | 0.27m | 1.09m | 0.7% |
| Airports | 1.85m | 7.4m | 4.9% |
| Total (UK modelled) | ? 37m | ? 149m | 100% |
All data is publicly available, and assumptions are transparent. The study represents the first quantified picture of the UK’s hidden movement infrastructure: the castors, wheels and systems that make modern life possible.
If you have a question around a product, or just a general query. Call us on 01296 431135, or submit the form below.
Receive 10% off of your first order with Coldene, use code WELCOME10